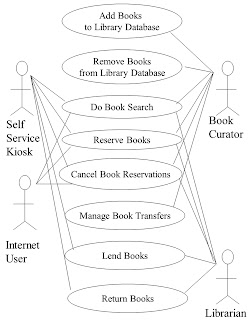
In this post I'll work through an example, evaluating the risk exposure of the use cases for a new public library book management system, an example that runs throughout my book.
 |
| Use case diagram for library management system |
- Add Books to Library Database
- Cancel Book Reservations
- Do Book Search
- Lend Books
- Manage Book Transfers
- Remove Books from Library Database
- Reserve Books
- Return Books
Working Through the Matrix: Team Alignment
There's no one right way to fill out a Boston Matrix, especially in a workshop setting. But here's one suggestion, and how I'll proceed here. Pick one of the two axis -- frequency of use, or severity of failure -- then have your team start by splitting the set of use cases based on that single criterion. In the example below, I've chosen to split the use cases based on frequency of use. |
| Start of Boston Matrix for analysis of use case risk exposure |
To illustrate, here's a dialogue between team members typical of those that might arise in a workshop:
Joe: "No way, that split doesn't look right!"The team has just reached alignment on what was previously an unshared assumption!
Sue: "Why do you say that?"
Joe: "Because XYZ .."
Sue: "Oh, well I didn't know you were assuming XYZ .. is that a valid assumption?"
Joe: "Well I think so because I spoke with the customer last week and they said ABC .."
Sue: "Ah, Ha!, well, I'm glad you brought that up, I didn't know that; it's good we all know that now!"
Determining Severity of Failure
Having split the use cases into two groups based on frequency of use, I'll next split the use cases into two groups based on severity of failure. Again this is just how I'm working the example; in a workshop setting there are any number of ways you could have your team approach this, for example using a group decision making technique such as dot-voting / multi-voting tailored to the Boston Matrix.You may find the severity of failure harder to pin down than frequency of use. Here are some factors to consider. First, there is the matter of the unit of measure for severity. Common units of measure for severity are cost, lost time (e.g. system downtime), and for safety-critical systems, deaths and/or injuries.
And given any one of these units of measure – cost, lost time, etc.. – you have to also decide what it is that needs to be measured. For example for cost, is it the cost to repair a failure; or the cost of lost revenue due to a failure; perhaps both?
Finally, as Musa et al [1] point out, the severity of failure depends a lot on whose perspective you choose to measure it from. A defect / failure that is relatively inexpensive to correct from a development standpoint can be catastrophic to a customer, and vice versa.
Having a team work through questions such as these will be a fruitful exercise in identifying issues, and getting the team on the same page.
Finalizing the Matrix
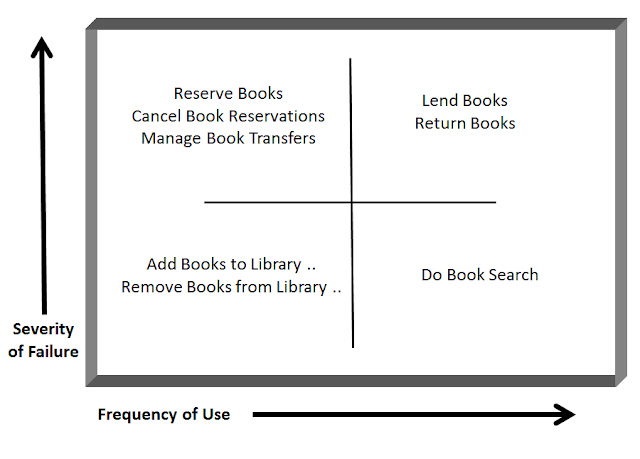
The completed Boston Matrix is shown below. Having triaged the use cases by risk exposure, I now have a better idea of the biggest bang for the buck in terms in terms of test design, and test execution: Lend Books and Return Books being the riskiest of the bunch; frequently used, with high severity of failure.What, you don't agree? Well then, we have just identified a misalignment in our priorities for test design. See? The process works great!
 |
| A Boston Matrix for analyzing risk exposure of use cases of library management system |
[1] John Musa, Anthony Iannino, and Kazuhira Okumoto, Software Reliability: Measurement, Prediction, Application. McGraw-Hill, 1990

No comments:
Post a Comment