Pages

Tuesday, December 29, 2015

Boston Matrix for Quick Triage of Use Cases Based on Risk Exposure


In the last post I talked about how to apply the concept of risk exposure to the data of your system or application. The risk exposure of an event is the likelihood that the event will actually happen, multiplied by the expected severity of the event. Each time your customer runs a use case, there is some chance that they will encounter a defect in the product. For use cases, failure is the "event" whose risk exposure we'd like to know. What you’d like to have is a way to compare the risk exposure from use case to use case so you can work smarter, planning to spend time making those use cases with the highest risk exposure more reliable.

In my book, Use Case Levels of Test, I look at an an extension of the product's operational profile to provide a quantitative way to compare risk exposure across all the use cases of a use case diagram. But in this post we'll look at a quick and easy way to do this that works great for example in test team planning workshops using the white board.


The Boston Matrix

The Boston Matrix is said to have been created by the Boston Consulting Group (hence the name) as a tool for product portfolio analysis.  It was originally presented as a way to categorize a company's product portfolio into four quadrants based on two scales: current market share and potential future market growth. The idea is to identify your product "stars" (large market share with potential for even more growth), "dogs" (low market share, not much potential for growth), etc. It's a way to triage a product portfolio for future development (spend less on dogs, more on stars).

But the Boston Matrix is a great tool for quickly categorizing any set of things. Below is a Boston Matrix set up for triaging use cases based on their risk exposure, with the horizontal axis representing how frequently you expect a use case to be used, and the vertical axis representing the severity of failures in a use case.

A Boston Matrix for analyzing risk exposure of use cases
A Boston Matrix for analyzing risk exposure
The idea is to assign each use case for which you need to design tests into one of four quadrants. The upper right quadrant represents those use cases that are both frequently used, with high severity failure and hence have the biggest bang for the buck in terms of making sure they are thoroughly tested and reliable. Conversely the lower left quadrant represents use cases that are infrequently used, and if they fail, the severity is low. When test design time is at a premium these use cases are the ones to test lighter.

As I noted above, this is a great tool for test team planning workshops. As with any workshop, an important part of working through assigning use cases to each quadrant will be the “Ah, Ha!” moments that occur. As a test designer, be prepared to capture ideas, issues, assumptions, notes and questions that will inevitably arise.

In the next post we'll work through an example, evaluating the risk exposure of the use cases for a new public library book management system.

Wednesday, December 23, 2015

The C.R.U.D. Matrix & Calculating the Risk Exposure of Data

I worked for a number of years at Landmark Graphics (now a part of Halliburton), a leader in software development for the oil and gas industry. Landmark’s strategic business goal was heavily dependent upon integration across its wide product suite, assembled through acquisition of some 25+ formerly separate small companies with diverse cultures (500+ R&D staff in 5+ cities, 40+ products). And that product integration was in turn heavily dependent upon development of a common data model to facilitate data sharing across its product suite.

Landmark is a good example of how sometimes it is useful from a test planning perspective to understand the risk of a release in terms of the data; e.g. what data has a high risk of being corrupted, and hence warrants closer scrutiny in testing.

So in this post let’s look at a quick way to leverage the work we’ve already done in previous posts developing a C.R.U.D. matrix, to help us spot high risk data in our system.


Risk Exposure

First off, what do we mean by “risk”? The type of risk I'm talking about is quantified, and used for example in talking about the reliability of safety critical systems. It’s also the type of “risk” that the actuarial scientists use in thinking about financial risks: for example the financial risk an insurance company runs when they issue flood insurance in a given geographical area.

In this type of risk, the risk of an event is defined as the likelihood that the event will actually happen, multiplied by the expected severity of the event. If you have an event that is catastrophic in impact, but rarely happens, it could be low risk (dying from shock as a result of winning the lottery for example).

What’s all this about “events”? Well, each time your customer runs a use case, there is some chance that they will encounter a defect in the product. That’s an event. So what you’d like to have is a way to quantify the relative risk of such events from use case to use case so you can work smarter, planning to spend time making the riskier use cases more reliable. The way we do this is risk exposure. Likelihood is expressed in terms of frequency or a probability. The product – likelihood times severity – is the risk exposure.

What I want to do in this post is show how to apply risk exposure to the data of your system or application.


Leveraging the C.R.U.D. Matrix

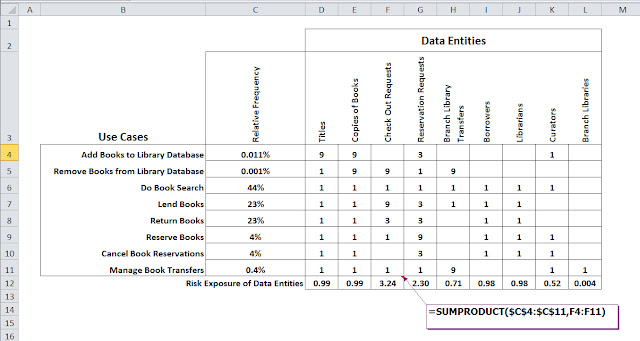
Notice the QFD matrix below is similar to the C.R.U.D. matrix we developed in the previous posts; rows are use cases and columns data entities.

Hybrid C.R.U.D. / QFD matrix to assess risk exposure of data entities

What we've added is an extra column to express the relative frequency of each use case (developed as part of the operational profile; discussed in the book) and severity each use case poses to the data. The numbers in the matrix – 1, 3, 9 – correspond to the entries in the C.R.U.D. matrix from the previous post. Remember, the C.R.U.D. matrix is a mapping of use cases (rows) to data entities (columns), and what operation(s) each use case performed on the data in terms of data creation, reading, updating and deleting.

For the QFD matrix shown here, to get a quick and dirty estimate of severity, we simple reuse the body of the C.R.U.D. matrix (previous post) and replace all Cs and Ds with a 9 (bugs related to data creation and deletion would probably be severe); all Us we replace with 3 (bugs related to data updates would probably be moderately severe); and all Rs with 1 (bugs related to simply reading data would probably be of minor severity).

This is of course just one example of how to relatively rank severity; you might well decide to use an alternate scale (perhaps you can put a dollar figure to severity in your application; discussed in the book).

The bottom row of the QFD matrix then computes the risk exposure (Excel formula shown) of each data entity based on both the relative frequency and relative severity. In our example, data entities Check Out Requests and Reservation Requests have high relative risk exposures. In the book this information (what are the high risk data entities) is utilized to prioritize data lifecycle test design, and also to prioritize brainstorming of additional tests by virtue of modeling.


Wednesday, December 16, 2015

Using the C.R.U.D. Matrix to Spot What's Missing

In the previous post we looked at how to build a C.R.U.D. matrix to help determine the test adequacy of a use case diagram. With C.R.U.D. matrix completed, in this post we now ask: How adequately does our set of use cases – our basis of testing -- exercise the full life-cycle of the data entities we’ve identified? We check this with our C.R.U.D. matrix by scanning each data entity’s column looking for the presence of a “C”, “R”, “U”, and “D”, indicating that the data’s life-cycle has been fully exercised by the set of use cases.

We continue here with same example from the book, the use case diagram for a new public library book management system. The C.R.U.D. matrix we created in the previous post is below:

C.R.U.D. matrix for library management system

By reviewing each data entity's column in the matrix we find the following holes in our coverage of the data:
  • Titles is read by every use case, but none create, update or delete a title.
  • Copies of Books is read by all use cases, but none create, update or delete a copy of a book.
  • Check Out Requests and Branch Library Transfers are created, read and updated by our use cases, but no use case deletes a check out request or library transfer.
  • Borrowers, Librarians, Curators and Branch Libraries are all read by our use cases, but none create, update or delete these data entities.
To beef up coverage of the data, we decide we’ll need two new use cases:

Add Books to Library Database - This use case adds a new copy of a book to the library holdings. But before it can add a new copy, the title is validated (read) to make sure its registered with the library. If not, a new title record is created tracking information common to future copies of this book (create). Also, the curator making the addition is authenticated (read). Finally, a check is made of pending reservation requests for this book title (read); if one exists (next in line for the book if there are multiple), the reservation is flagged to notify person reserving the book (update).

Remove Books from Library Database - This use cases removes a copy (but not the title) of a book from the library’s holdings. The curator doing the remove is authenticated (read), the title is validated (read), the particular copy of the book to be removed is validated (read). Also, confirmation is made that the book is not currently checked out (read); not on loan to a branch library (read); and not a copy that has been pulled by a librarian for pending pickup by a borrower, e.g. was reserved on-line (read). Once validated, the tracking records for this book copy is deleted from the library tracking system, i.e. information about the particular copy, checkout history, branch library transfer history.

With these additional use cases, we still have a few holes in our coverage of the data:
  • No use cases update or delete titles
  • No use cases update the information kept for particular copies of each book, say to correct the date of acquisition, or from where it was acquired, etc.
  • While book reservations are created, read and updated by the use cases, none delete the backlog of old reservations.
  • And no use cases create, update or delete the system’s borrowers, librarians, curators, or branch libraries.
To complete the C.R.U.D. matrix, we fill-in the last row (“Don’t Care”) to designate the data operations we are willing to allow to fall out of scope for test at this point, because say the code to support those operations is pending, or those operations are considered low risk for the time being.

It’s worth emphasizing, sometimes saying what you are not going to test is every bit as important as saying what you are going to test (“What, you didn’t test that? Had I known that I would have said something in the review of the test plan!!”). So while not common on a C.R.U.D. matrix, adding a row called “Don’t Care” is a smart thing to do as a test designer.

Revised C.R.U.D. matrix is below featuring two new use cases and completed “Don’t Care” row. Changes from previous matrix are highlighted in grey and red. Notice now that each column includes at least one create (C), read (R), update (U) or delete (D).

Revised C.R.U.D. matrix for library management system with missing use cases identified


Saturday, December 12, 2015

Determining the Test Adequacy of a Use Case Diagram with a C.R.U.D. Matrix

What's the test adequacy of this use case diagram?

What's the test adequacy of this use case diagram?

In the last blog I noted that the strategy for test design I use in my book -- Use Case Levels of Test -- involves using a set of use cases associated with a use case diagram as a starting point. As such it makes sense to first begin by asking: Is the use case diagram missing any use cases essential for adequately testing? To address this question, I talked about the use of a C.R.U.D. matrix. In this post let’s look at how we can build a C.R.U.D. matrix to help determine the test adequacy of the use case diagram. For the blog I'll use the same example from the book, the use case diagram for a new public library book management system.

We begin by simply listing the use cases of our use case diagram as rows of the C.R.U.D. matrix. In addition to the use cases, you may find it useful to add one extra row at the bottom, and label it something like “Don’t Care”; As we start working through the C.R.U.D. matrix we may find some aspect of the data that isn’t being exercised (that’s the whole point of the C.R.U.D. matrix). But it also may be that in some cases we determine it’s ok, and will consider that out of scope for test design. This row – Don’t Care – allows us to make a note of that fact.

Next, as columns of the matrix we list the data entities pertinent to the testing of the system. Data entities are those things in your business, real or abstract, for which the system will be tracking information. I’m using the term “data entity” to be general and avoid implementation specific terms like “object”, “class” or “database table”. That’s not to say these things are excluded from what a tester might use in the C.R.U.D. matrix; I’m just trying to avoid giving the impression that the C.R.U.D. matrix is only relevant to testers working e.g. on object-oriented systems, or database systems where object / data models are available for the tester to reference.

In use case development, this process of “discovering” the data entities relevant to the use cases is called domain analysis. As a tester one may have to do a bit of domain analysis. Just remember, as a tester, you aren’t doing domain analysis in order to arrive at an object-model or data-model that will influence the architecture of your system (let the system analysts and developers lose sleep over that!). You just need a set of data entities as basis for judging the test adequacy of the use cases, i.e. how well do they exercise the underlying data.

With rows (use cases) and columns (data entities) in place, we now work through the matrix noting how each use case interacts with the data entities. The completed C.R.U.D. matrix for our library use case diagram is shown below.

C.R.U.D. matrix for library management system

An important point to make here that will not be immediately obvious from simply looking at the matrix is that the act of actually working through the matrix is part of the true benefit.

By systematically analyzing every use case in terms of each data entity, and asking “Does it create, read, update or delete this?”, you are doing test design. Think of the C.R.U.D. matrix as a high level test case for the entire system, providing expected inputs (read), and outputs (create, update, delete) for the entire system in a compact, succinct form.

A very important part of working through the C.R.U.D. matrix –beyond testing the adequacy of the use case diagram -- is the discovery and “Ah, Ha!” moments that will occur while systematically analyzing the interaction of use cases and data entities. As a test designer, be prepared to capture ideas, issues, assumptions, notes and questions that will inevitably arise as you work through the C.R.U.D.

Working through the C.R.U.D. matrix is test design!

In the next blog we ask: What's Missing?!


Tuesday, December 1, 2015

Test Adequacy of a Use Case Diagram

The strategy for test design I use in my book -- Use Case Levels of Test -- involves using a set of use cases associated with a use case diagram – the view of the system to be tested from 30,000 feet -- as a starting point. As such it makes sense to first begin by asking: Is the use case diagram missing any use cases essential for adequately testing?

Test adequacy is typically demonstrated via how well a suite of tests “cover” the item from which tests are being designed. This is called test coverage. Here’s how ISTQB defines it:
“Test coverage is the degree ... to which a specified coverage item has been exercised by a test suite”

The C.R.U.D. Matrix; Its Role in Determining the Test Adequacy of a Use Case Diagram

While most of the techniques in the book use the use case as the basis for test coverage – How well do the tests cover some aspect of a use case? – at the use case diagram level where our test design starts, we need some ruler that both measures collections of use cases as a whole, and is separate from the use cases themselves. For this we drop down out of the clouds at the 30,000-foot level (the use case diagram level) down to ground level, to the data that underlies the business domain. And the mechanism we use for analyzing the test adequacy of the use cases in terms of the business domain data is the C.R.U.D. matrix.

The C.R.U.D. matrix originated in the 1970s-80s as part of the structured analysis and design wave in software development. In structured analysis and design, system modeling focused on a process model – say via a dataflow diagram – and a data model, e.g. a entity-relationship diagram. What was needed was a way to make sure the two jived with one another. The C.R.U.D. matrix provided this. The C.R.U.D. matrix provides a way to analyze interaction of process and data by saying all computing boils down to basically four types of interactions between process and data: Creating data, Reading data, Updating existing data, or Deleting data, hence the name C.R.U.D.. Numerous alternate categorizations and extensions based on this theme have been proposed, but you get the idea.

The C.R.U.D. matrix has been thoroughly covered in the software literature primarily in terms of databases. But it’s also found its way into the use case and testing community, and specific to use case driven testing, Binder[1] has described the use of a C.R.U.D. matrix as a basis for determining test coverage as part of his Extended Use Case Test pattern. As Binder notes
"Test suites developed from individual use cases .. cannot guarantee that all of the problem domain classes in the system under test have been reached. The Covered in C.R.U.D. pattern is a simple technique for identifying such omissions"
 In a future blog we'll look at going from use case diagram to C.R.U.D. matrix, and how to spot use cases that may be missing for adequate testing of a system.


[1] Robert Binder, Testing Object-Oriented Systems: Models, Patterns, and Tools, 2000


Wednesday, November 25, 2015

Use Case Levels of Test: Parts I - IV of the Book

Book is organized around four use case levels of test

Four Use Case Levels of Test

In my book, Use Case Levels of Test, I like to use the analogy of the “View from 30,000 feet” to illustrate the role of use case levels to zoom from the big-picture (the major interstate highways through your application) down to discrete operations that form the steps of a use case scenario. These use case levels of test provide a sort of road map on how to approach test design for a system, working top-down from the 30,000-foot view to ground level.

The four parts of the book are organized around these four levels of use case test design. The bit of pseudo code below illustrates a strategy for using the parts of the book.


Apply Part I to the Use Case Diagram. This produces a test adequate set of prioritized use cases with budgeted test design time for each, as well as integration tests for the set

For each use case U from the previous step, until budgeted time for U expires do:
·         Apply Part II to use case U to produce a set of tests to cover its scenarios
·         For each test T  from the previous step, in priority order of the scenario T covers do:
o   Apply Part III to test T creating additional tests based on inputs and combinations of inputs
o   Apply Part IV to any critical operations in test T producing additional tests based on preconditions, postconditions and invariants


Timeboxing, Operational Profile, and Use Case Levels of Test

Recall from a previous post that this book is organized around a strategy of budgeting test design time for each use case, often referred to in planning as timeboxing. But rather than an arbitrary allocation of time (say equal time for all), time is budgeted based on an operational profile: an analysis of the high traffic paths through your system.

Because parts II-IV are timeboxed according to the operational profile (notice the phrase “until budgeted time expires”) this strategy will produce more tests for use cases frequently used. This is the key contribution from the field of software reliability engineering to maximize quality while minimizing testing costs.

This strategy is graphically depicted below. Numbers refer to the parts – 1 through 4 --  of the book.

Strategy for budgeting test design time to maximize quality while minimizing testing costs

Let’s walk through each part of the book and see what is covered.


Part I The Use Case Diagram

Part I of the book starts with the view of the system from 30,000 feet: the use case diagram. At this level the system is a set of actors, interacting with a system, described as set of use cases. Paths through the system are in terms of traffic trod across a whole set of use cases, those belonging to the use case diagram

As tests at lower levels will be based on these use cases, it makes sense to begin by asking: Is the use case diagram missing any use cases essential for adequate testing? This is addressed in Chapter 1 where we look at the use of  a C.R.U.D. matrix, a tool allowing you to judge test adequacy by how well the use cases of the use case diagram cover the data life-cycle of entities in your system. Not only does the C.R.U.D. matrix test the adequacy of the use case diagram, it is essentially a high level test case for the entire system, providing expected inputs (read), and outputs (create, update, delete) for the entire system in a compact succinct form.

Still working at the use case diagram level, in Chapter 2 we look at another tool – the operational profile – as a way to help you, the tester, concentrate on the most frequently used use cases, and hence those having a greater chance of failure in the hands of the user. The chapter describes how to construct an operational profile from the use case diagram, and the use of an operational profile as a way to prioritize use cases; budget test design time per use case; spot “high risk” data; and design load and stress tests.

Chapter 3 wraps up the look at testing at the use case diagram level by introducing techniques for testing the use cases in concert, i.e. integration testing of the use cases.


Part II The Use Case

Part II drops down to the 20,000-foot view where we have the individual use case itself. At this level of test paths through the system are in terms of paths through an individual use case.

In Chapter 4 the book looks at control flow graphs, a graph oriented approach to designing tests based on modeling paths through a use case. For use case based testing, control flow graphs have a lot going for them: easy to learn, work nicely with risk driven testing, provide a way to estimate number of needed tests, and can also be re-used for design of load tests.

Chapter 5 looks at two alternate techniques for working with use cases at this level of test: decision tables and pairwise testing. A decision table is a table showing combinations of inputs with their associated outputs and/or actions (effects): briefly, each row of the decision table describes a separate path through the use case.

For some use cases any combination of input values (or most) is valid and describes a path through the use case. In such cases, the number of paths becomes prohibitive to describe, much less test! Chapter 5 concludes with a technique to address such use cases: pairwise testing.


Part III A Single Scenario

In this part of the book we arrive at the 10,000-foot view and test design will focus on a single scenario of a use case. While a scenario represents a single path through the system from a black-box perspective, at the code level different inputs to the same scenario likely cause the code to execute differently.

Chapter 6 looks at test design from scenario inputs in the hope that we are more fully testing the paths through the actual code, looking at the most widely discussed topics in input testing: error guessing, random input testing, equivalence partitioning, and boundary value analysis.

For a use case scenario with more than a single input, after selecting test inputs for each separate input there’s the question of how to test the inputs in combination. Chapter 6 concludes with ideas for “working smart” in striking the balance between rigor and practicality for testing inputs in combination.

Chapter 7 looks at additional (and a bit more advanced) techniques for describing inputs and how they are used to do equivalence partitioning and boundary value analysis testing.  The chapter begins with a look at syntax diagrams, which will look very familiar as they re-use directed graphs (which you’ll have already seen used as control flow graphs in Chapter 4).

Regular expressions are cousins of syntax diagrams, though not graphic (visual) in nature. While much has been written about regular expressions, a goal in Chapter 7 is to make a bit more specific how regular expressions relate to equivalence partitioning and boundary value analysis.  A point that doesn’t always seem to come across in discussing the use of regular expressions in test design.

For the adventuresome at heart the last technique discussed in Chapter 7 is recursive definitions and will include examples written in Prolog (Programming in Logic). Recursion is one of those topics that people are sometimes intimidated by. But it is truly a Swiss-army knife for defining, partitioning and doing boundary value analysis of all types of inputs (and outputs) be they numeric in nature, sets of things, Boolean or syntactic.


Part IV Operations

In Part IV, the final part of the book, we arrive at “ground level”: test design from the individual operations of a use case scenario. A use case describes the behavior of an application or system as a sequence of steps, some of which result in the invocation of an operation in the system. The operation is the finest level of granularity for which we’ll be looking at test design. Just as varying inputs may cause execution of different code paths through a single use case scenario, other factors – e.g. violated preconditions – may cause execution of different code paths through a single operation.

In Chapter 8 Preconditions, Postconditions and Invariants: Thinking About How Operations Fail, we’ll look at specifying the expected behavior of abstract data types and objects – model-based specification – and apply it to use case failure analysis: the analysis of potential ways a use case operation might fail. In doing so, the reader will learn some things about preconditions and postconditions they forgot to mention in “Use Case 101”!

You may find Chapter 8 the most challenging in the book as it involves lightweight formal methods to systematically calculate preconditions as a technique for failure analysis. If prior to reading this book your only exposure to preconditions and postconditions has been via the use case literature, this chapter may be a bit like, as they say, “drinking from a fire hose”.  For the reader not interested in diving this deep, the chapter concludes with a section titled The Least You Need to Know About Preconditions, Postconditions and Invariants, providing one fundamental lesson and three simple rules that the reader can use on absolutely any use case anytime.

Having gained some insight into the true relationship between preconditions, postconditions and invariants in Chapter 8, Chapter 9 provides “lower-tech” ways to identify preconditions that could lead to the failure of an operation. We’ll look at ways to use models built from sets and relations (i.e. discrete math for testers) to help spot preconditions without actually going through the formalization of calculating the precondition. More generally we’ll find that these models are a good way to brainstorm tests for use cases at the operation level.

Friday, November 20, 2015

Working Smart in Software Test Design: The Role of Use Cases

In my last post I said one of the key goals of my book, Use Case Levels of Test, is to provide you – the tester tasked with designing tests for a system or application – a strategy for budgeting test design time wisely.

My assumption is that you are working in a software development shop where use cases have been used in-whole or in-part to specify the system or application for which you’ve been tasked to write tests, or alternatively you are familiar enough with use cases to write them as proxy tests before starting real test design.

Use cases play a key role in the “working smart” strategy presented in this book; let’s see why.


Use Cases: Compromise Between Ad Hoc And “Real Tests”

Part of the reason use cases have gained the attention they have in testing is that they are already pretty close to what testers often write for test cases.

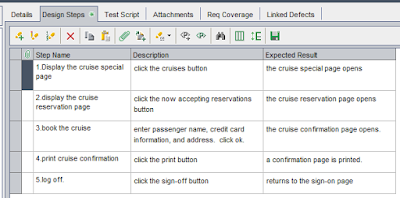
One of the leaders in the testing tool arena is HP’s Quality Center (formerly Mercury Test Director). The example test shown below is part of a Quality Center tutorial in which the tester is instructed that “After you add a test  ... you define test steps -- detailed, step-by-step instructions  ... A step includes the actions to be performed on your application and the expected results”. As the example illustrates, anyone comfortable with writing use cases would be comfortable writing tests in Quality Center, and vice versa.

Anyone comfortable with writing use cases would be comfortable writing test cases in Quality Center, and vice versa

The early availability of use cases written by a development team gives testers a good head start on test design. What this means for our strategy is that, in a pinch (you’ve run out of time for test design) use cases provide a good compromise between ad hoc testing and full blown test cases.

On the one hand, ad hoc testing carries the risks of unplanned, undocumented (can’t peer review; not repeatable) testing that depends solely on the improvisation of the tester to find bugs. On the other hand we have full-fledged test cases for which even Boris Beizer, a proponent of “real testing” vs. “kiddie testing”, has said “If every test designer had to analyze and predict the expected behavior for every test case for every component, then test design would be very expensive”.

So use cases provide a good balance between the informal and formal. By starting test design from a set of use cases a test team can design full-fledged test cases as time permits from the most important use cases, and for the rest allow testers to “pound away” on and off the happy path; a sort of controlled ad hoc testing where use cases provide some order to the otherwise unplanned and undocumented testing.


Use Case Levels of Test

Another facet of use cases key to the strategy presented in this book is a way to decompose a big problem (say, write tests for a system) into smaller problems (e.g. test the preconditions on a critical operation) by using use case levels of test.

So what do I mean by use case levels of test? Most testers are familiar with the concept of levels of test such as systems test (the testing of a whole system, i.e. all assembled units), integration test (testing two or more units together), or unit test (testing a unit standalone). Uses cases provide a way to decompose test design into levels of test as well, not based on units, but rather on increasingly finer granularity paths through the system.

The parts of my book are organized around four levels of use case test design. In the book I like to use the analogy of the “View from 30,000 feet” to illustrate the role of use case levels to zoom from the big-picture (the major interstate highways through your application) down to discrete operations that form the steps of a use case scenario. This is illustrated in the figure below.

The four use case levels of test

Let’s start with the view of the system from 30,000 feet: the use case diagram. At this level the system is a set of actors, interacting with a system, described as a set of use cases. This is the coarsest level of paths through your system; the collection of major interstate highways of your system.

Dropping down to the 20,000-foot view we have the individual use case itself, typically viewed as a particular “happy path[1] through the system, with associated branches, some being not so happy paths. In other words, a use case is a collection of related paths – each called a scenario -- through the system.

From there we drop to the 10,000-foot view which zooms in on a particular scenario of a use case, i.e. one path through a use case. While a scenario represents a single path through the system from a black-box perspective, different inputs to the same scenario very likely cause the underlying code to execute differently; there are multiple paths through the single scenario at the code level.

And finally, at ground level we reach discrete operations; the finest granularity action / re-action of the dance between actor and system. These are what make up the steps of a scenario. At this level paths are through the code implementing an operation. If dealing with an application or system implemented using object-oriented technology (quite likely), this could be paths through a single method on an object. A main concern at this level are the paths associated with operation failures; testing conditions under which a use case operation is intended to work correctly, and conversely the conditions under which it might fail.

The fact that use cases provide an alternate way to view levels of test wouldn’t necessarily be all that interesting to the tester but for a couple of important facts.

First is the fact that the levels are such that each has certain standard black-box test design techniques that work well at that level. So the use case levels of test provide a way to index that wealth of black-box testing techniques; this helps answer that plea of “Just tell me where to start!”.

Second, for each use case level of test, the “path through a system” metaphor affords a way to prioritize where you do test design at that level, e.g. spending more time on the paths most frequently traveled by the user or that touch critical data.


[1] If you are unfamiliar with this term, the “happy path” of a use case is the default scenario, or path, through the use case, generally free of exceptions or errors; life is "happy".

Pages