Landmark is a good example of how sometimes it is useful from a test planning perspective to understand the risk of a release in terms of the data; e.g. what data has a high risk of being corrupted, and hence warrants closer scrutiny in testing.
So in this post let’s look at a quick way to leverage the work we’ve already done in previous posts developing a C.R.U.D. matrix, to help us spot high risk data in our system.
Risk Exposure
First off, what do we mean by “risk”? The type of risk I'm talking about is quantified, and used for example in talking about the reliability of safety critical systems. It’s also the type of “risk” that the actuarial scientists use in thinking about financial risks: for example the financial risk an insurance company runs when they issue flood insurance in a given geographical area.In this type of risk, the risk of an event is defined as the likelihood that the event will actually happen, multiplied by the expected severity of the event. If you have an event that is catastrophic in impact, but rarely happens, it could be low risk (dying from shock as a result of winning the lottery for example).
What’s all this about “events”? Well, each time your customer runs a use case, there is some chance that they will encounter a defect in the product. That’s an event. So what you’d like to have is a way to quantify the relative risk of such events from use case to use case so you can work smarter, planning to spend time making the riskier use cases more reliable. The way we do this is risk exposure. Likelihood is expressed in terms of frequency or a probability. The product – likelihood times severity – is the risk exposure.
What I want to do in this post is show how to apply risk exposure to the data of your system or application.
Leveraging the C.R.U.D. Matrix
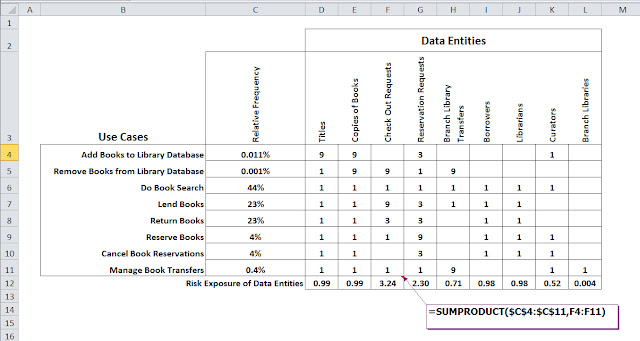
Notice the QFD matrix below is similar to the C.R.U.D. matrix we developed in the previous posts; rows are use cases and columns data entities. |
| Hybrid C.R.U.D. / QFD matrix to assess risk exposure of data entities |
What we've added is an extra column to express the relative frequency of each use case (developed as part of the operational profile; discussed in the book) and severity each use case poses to the data. The numbers in the matrix – 1, 3, 9 – correspond to the entries in the C.R.U.D. matrix from the previous post. Remember, the C.R.U.D. matrix is a mapping of use cases (rows) to data entities (columns), and what operation(s) each use case performed on the data in terms of data creation, reading, updating and deleting.
For the QFD matrix shown here, to get a quick and dirty estimate of severity, we simple reuse the body of the C.R.U.D. matrix (previous post) and replace all Cs and Ds with a 9 (bugs related to data creation and deletion would probably be severe); all Us we replace with 3 (bugs related to data updates would probably be moderately severe); and all Rs with 1 (bugs related to simply reading data would probably be of minor severity).
This is of course just one example of how to relatively rank severity; you might well decide to use an alternate scale (perhaps you can put a dollar figure to severity in your application; discussed in the book).
The bottom row of the QFD matrix then computes the risk exposure (Excel formula shown) of each data entity based on both the relative frequency and relative severity. In our example, data entities Check Out Requests and Reservation Requests have high relative risk exposures. In the book this information (what are the high risk data entities) is utilized to prioritize data lifecycle test design, and also to prioritize brainstorming of additional tests by virtue of modeling.

No comments:
Post a Comment