“More reliable software, faster and cheaper” - John Musa
In this post we are going to explore an important question related to working smart in test design: Does it really make sense to spend the same amount of time and rigor on test design for all use cases?A use case with many bugs can seem reliable if the user spends so little time running it that none of the many bugs are found. Conversely, a use case that has few bugs can seem unreliable if the user spends so much time running it that all those few bugs are found. This is the concept of perceived reliability: it is the reliability the user experiences, as opposed to a reliability measure in terms of, say, defect density.
An operational profile is a tool used in software reliability
engineering to spot the high traffic paths through your system. This allows you, the test designer, to
concentrate on the most frequently used use cases, and hence those having a
greater chance of failure in the
hands of the user. By taking such an approach, you work smarter—not harder—to
deliver a reliable product.
The field of software reliability engineering (SRE) is about increasing customer satisfaction by delivering a reliable product while minimizing engineering costs. Use case-driven development and SRE are a natural match, both being usage-driven styles of product development. What SRE adds to use case-driven development is a discipline for focusing time, effort, and resources on use cases in proportion to their estimated frequency of use to maximize quality while minimizing development costs. Or as John Musa says, “More reliable software, faster and cheaper.”
The Operational Profile
 |
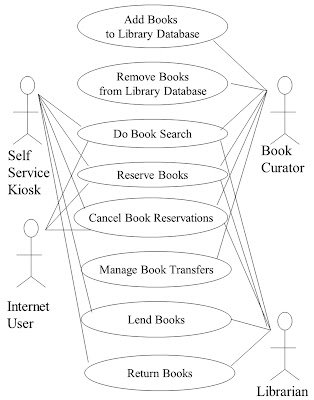
| Library management system use case diagram |
In the table, the second column shows the estimated number of times daily a use case will be executed; the third column shows the relative frequency of each use case, i.e. how frequently a use case is used relative to the others.
In the Pareto chart the left scale of the Y-axis displays the estimated number of times per day we expect each use case to be executed; the right scale of the Y-axis the cumulative relative frequency (which sums to 100%). Notice that over 90% of the usage is accounted for by just three use cases: Do Book Search, Lend Books, and Return Books.
 |
| Operational profile for above use case diagram (table form) |
 | ||
| Operational profile for above use case diagram (Pareto chart) |
Now, looking at the operational profile for the use case diagram, ask yourself this: Is applying the same amount of time and effort in test design to all use cases really the best strategy?
Another way to look at the frequency of use information of use cases is in terms of opportunities for failure. Think of it like this: use case Do Book Search is not just executed 2000+ a day; rather it has 2000+ opportunities for failure a day. Each time a use case is executed by a user it is an opportunity for the user to stumble onto a latent defect in the code; to discover a missed requirement; to discover just how user un-friendly the interface really is; to tax the performance of critical computing resources of the system like memory, disk and CPU.
With each additional execution of a use case the probability goes up that the execution will result in failure. Viewed as opportunities for failure in your production system, doesn’t it make sense to design and execute tests in relative proportion to the opportunities for failure that each use case will receive in production?
Assuming your convinced it’s worth doing a bit of analysis into which use cases are most highly trafficked before diving into writing tests ( “I just blew my budgeted time for test design writing tests for use cases that are rarely used!”), the next step is, how do we build an operational profile from the use case diagram? We'll look at that in the next post.