In the previous post we explored an important question related to working smart in test design:
Does it really make sense to spend the same amount of time
and rigor on test design for all use cases? We looked at the idea of an operational profile, a tool used in software reliability
engineering to spot the high traffic
paths through your system allowing you to
concentrate test design on the most frequently used use cases, and hence those having a
greater chance of failure
in the
hands of the user.
In this post we'll look at how to generate an operational profile from a use case diagram.
The QFD Matrix
QFD (Quality Function Deployment) is a product-planning tool that is used to translate business drivers into the technical requirements and design aspects of a product. Though originally developed for manufacturing industries in the 1960s, today QFD-like ideas are being used successfully for all sorts of applications, including software development, the services industry, and process management, and is considered an essential part of the quality improvement toolkit.
QFD boiled down to simple mechanics is about establishing priorities, the key tool being a QFD matrix. QFD is an ideal tool for representing a use case diagram – establishing links between actors and use cases -- and for generating an operational profile from that diagram.[1]
The easiest way to see how to generate an operational profile from a use case diagram using a QFD matrix is with an example. Using the public library book management system use case
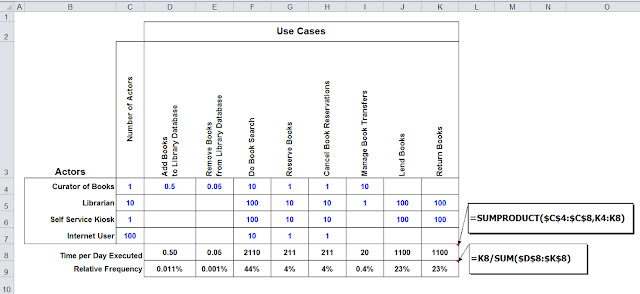
diagram from the previous post, we build a simple QFD matrix, here implemented as an Excel spreadsheet (below). In this matrix, all actors of the use case diagram are placed in rows, and the use cases are placed across the top as columns.
 |
| QFD matrix to generate operational profile from use case diagram; rows are actors, column use cases |
Quantify Numbers of Actors in Use Case Diagram
The next step in analyzing your use case traffic is to quantify the number of each type of
actor in the use case diagram. How many book curators are
there? How about librarians; self-service kiosks? Don’t get hung-up on precise
numbers; ball park numbers are all you need to understand the relative numbers
of actors, e.g. how many librarians do
you have relative to curators: Same amount; twice as many? How about internet users;
how many more than kiosks: Twice as many; a hundred times as many?
At this point you might say, “I have no idea how many internet users to expect!”. To which I
would respond: Bingo, we’ve just identified a non-functional requirement that
needs clarification! Asking questions about numbers of actors in the use case diagram is a healthy thing to be doing early on.
Keeping in mind that the goal is to get ballpark numbers for
the operational profile you might try this. Rather than agonizing over
whether there is one versus two book curators, or fifty versus two hundred
internet users, try working with orders
of magnitude. An order of magnitude estimate is one given in terms of a factor of
10:
100 = 1
101 = 10
102 = 100
103 = 1000
104 = 10,000
etc..
By their nature of separation, it’s usually easier to come
up with orders of magnitude estimates. What’s the average life of a person?
Rather than getting into debates about the numerous factors that affect
people’s longevity—health, lifestyle, country, even what century—it’s pretty
clear that it’s on an order of magnitude of 100 years; 10 is way too small and 1000 is way
too big. Use order of magnitude estimates to get you in the ball park, then
step back and refine your estimates if you feel so inclined, doubling here, and
halving there.
So for our library use case diagram, using
orders of magnitude estimates, let's say there is one curator, ten librarians, one self
service kiosk, and one hundred internet users that might be accessing the
system each day. This information is placed in the matrix in column Number of
Actors (below)
 |
| QFD matrix to generate operational profile from use case diagram; in this step you quantify the number of each type of
actor |
Quantify Use Case Frequency of Use by Actors
With estimates of numbers of each type of actor identified
you now turn to the question of who does what, i.e. which actors use what use cases .. and how often! In a use case diagram this information is captured as relationships
– depicted as lines – between actors and use cases.
In the QFD matrix it is captured by placing a number in the cell that
corresponds to the intersection of an actor (row) and use case (column). The
number you place in the cell is the number of times a “typical” actor of that
type will execute that use case per some unit of time, say daily. If an actor
never uses a particular use case the cell is left blank.
Again, using orders of magnitude to estimate frequency of
use will help avoid analysis paralysis. Once in the ballpark you can step back
and tweak the estimate, doubling here and halving there if needed. For the library use case diagram, orders of magnitude
estimates for each actor are provided in the matrix below;
frequency is given in times per day each use case is executed by each actor of that type.
 |
| QFD matrix to generate operational profile from use case diagram; cells show which actors use what use cases .. and how often! |
Notice that the Book Curator executes the Add Books to Library Database use case and Remove Books from Library Database use case .5 and .05 times a day, respectively. Are those order of magnitude estimates? Yes; when a use case is used less
than once per unit of time – here daily – you can get the order of magnitude estimate as follows. The curator adds about 100 books (order of magnitude)
a year; a year is about 200 working days, so the formula for calculating daily
use is:
Similarly, the curator removes about 10 books a year (order
of magnitude; the library is growing!), so
the formula for calculating daily use is:
10 / 200 = .05
Getting estimates of the number of actors of each type and frequency of use information is the hard part of analyzing the traffic through your use cases. All that is left is to crank out the results. The matrix below shows the final results: an estimate of the frequency of daily execution of each use case by all actors in the library book management system (also shown are the formulas you need for this; the top formula calculates absolute number of times per day; the bottom formula calculates relative frequency.)
 |
| Final QFD matrix to generate operational profile from use case diagram. |
In a future post we’ll look at how to put these relative frequencies to work
in test design.


